Head-to-head breakdowns of the AI models and tools that matter — on benchmarks, capabilities and price.
26 comparisons · benchmark figures anchored to the Artificial Analysis index v4.3.2, captured September 30, 2026 · newest comparison October 15, 2026
How these comparisons are made
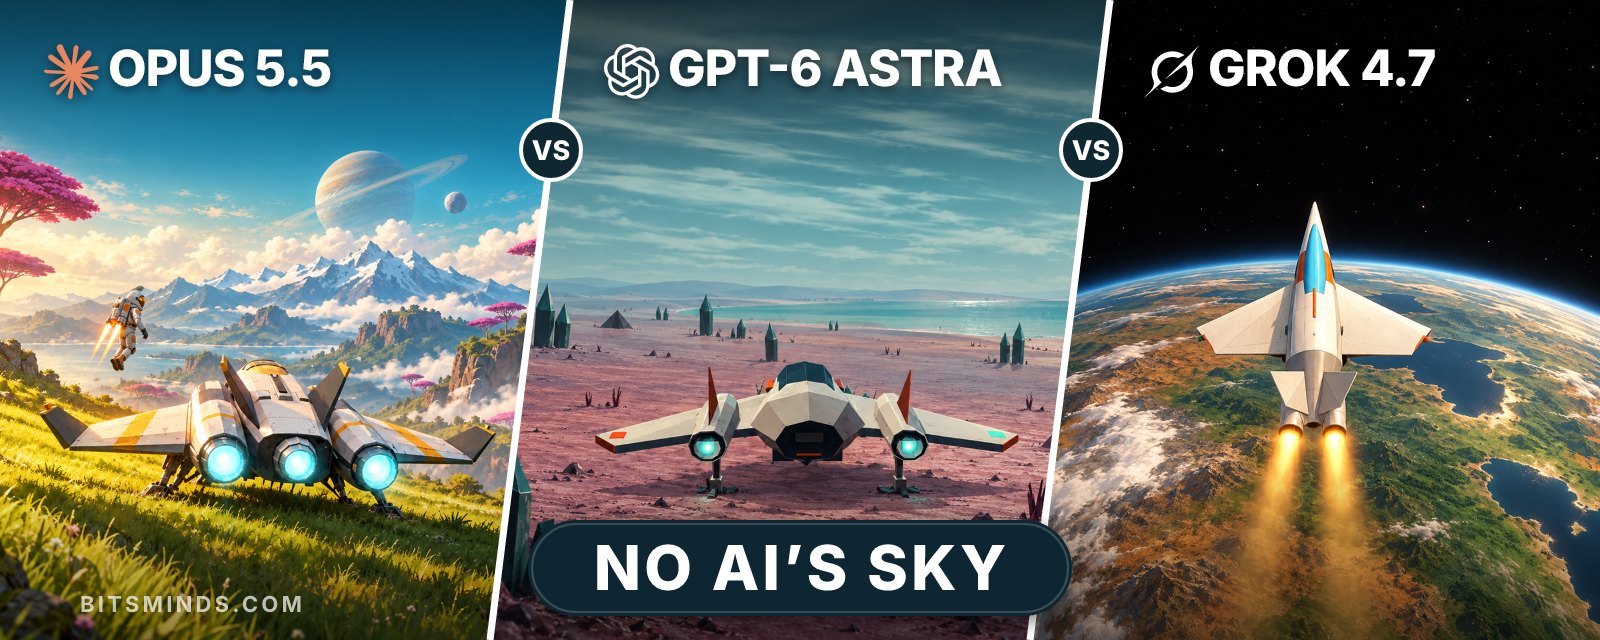
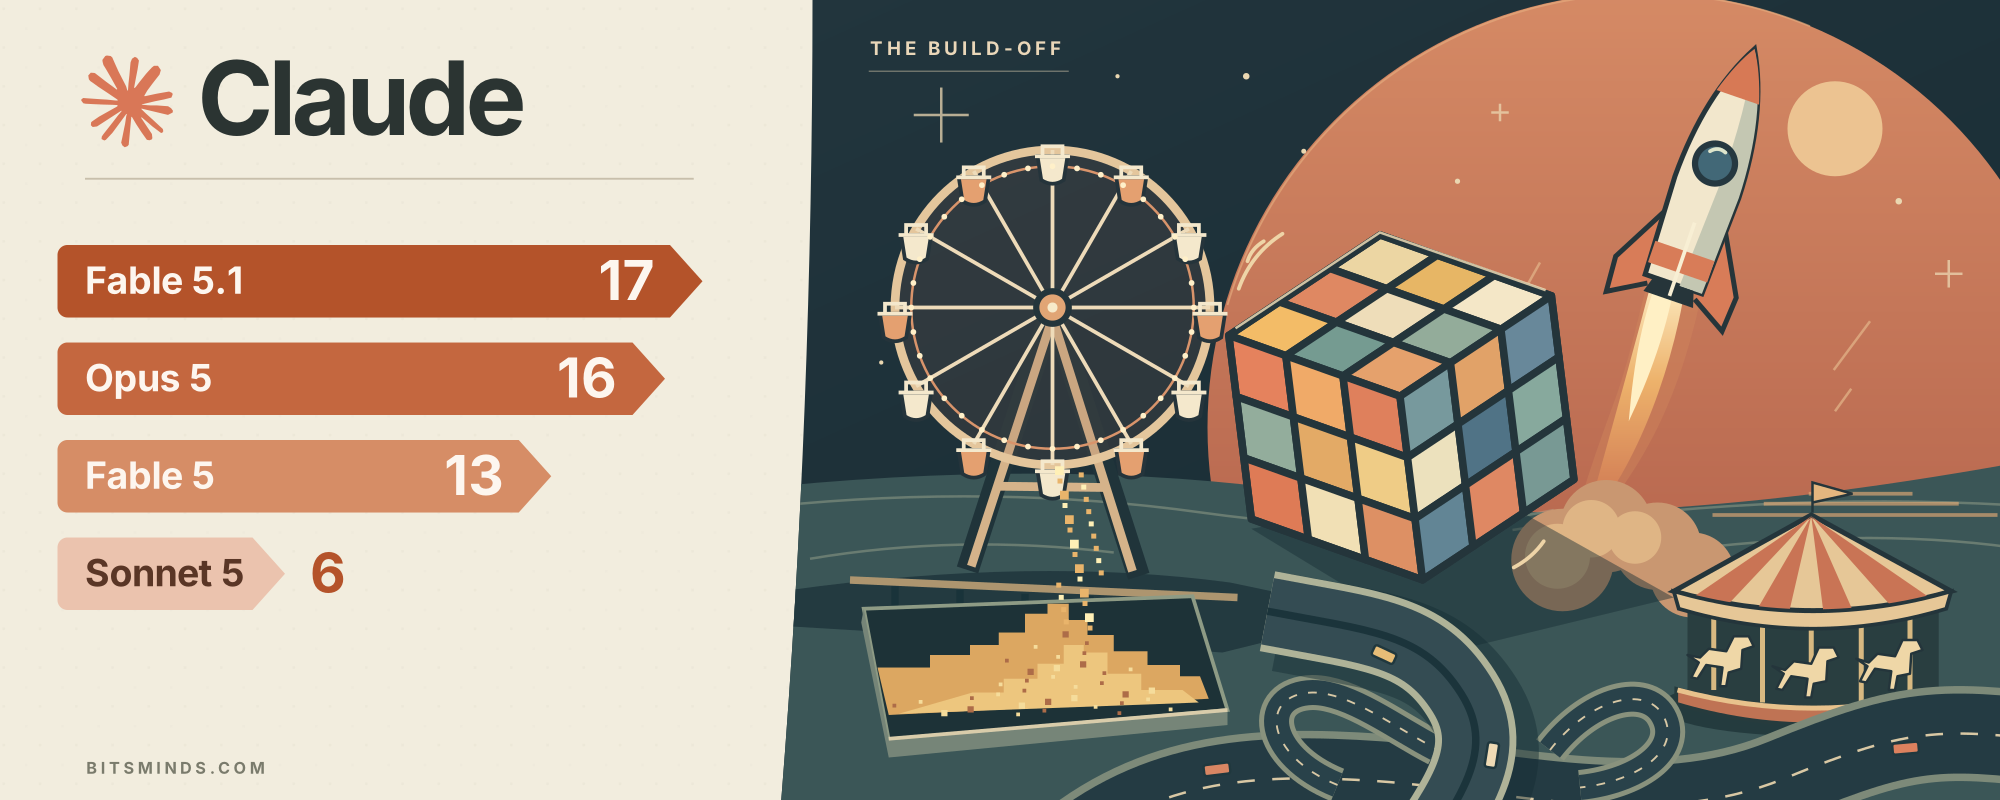
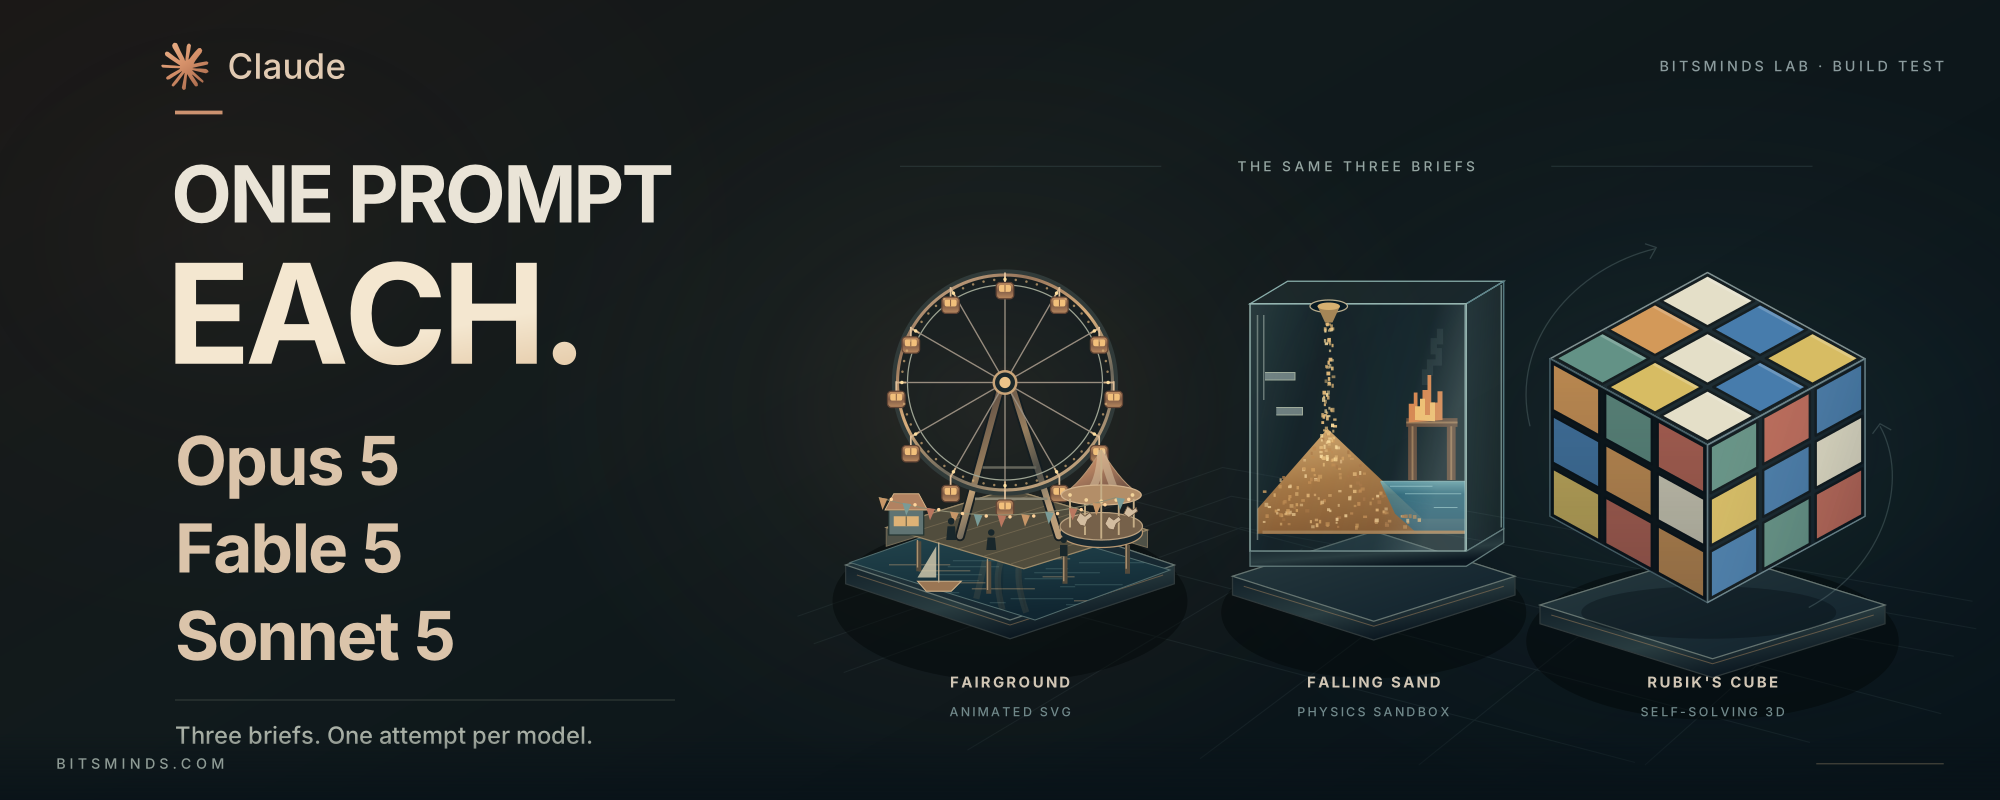
Every comparison on this page is one of two kinds, and the kind changes how much weight a verdict can carry. A benchmark comparison lines models up on published numbers: the independent Artificial Analysis Intelligence Indexwhere every model is measured under one methodology, and each vendor's own system-card figures where it is not. Those pieces always say which index version and which model configuration — maximum effort, high, medium — a score belongs to, because a score without its configuration is not a fact. A hands-on comparison comes from BitsMinds Lab: the same build brief to every model, one attempt each, and every build embedded in the article so you can check our scoring against the evidence.
How to read the numbers
Three habits keep these pages honest, and they are worth adopting as a reader. First, never compare index scores across articles from different months. Artificial Analysis re-bases the index when its evaluation set changes — the current version is v4.3.2— and every model's number moves with it, so a 61 in a July piece and a 53 in September can describe the same model on the same day. Second, separate the product from the model: a ChatGPT Plus review is about a $20 plan, a GPT-6 Astra comparison is about an API model, and the two change on different schedules. Third, read price as cost per finished task, not per token. Our GPT-6 Astra review is the worked example: two models at an identical $10/$50 list price, with a 2.7× gap in what the same benchmark cost to complete, because one used a third of the tokens.
Where the data comes from
Benchmark figures are transcribed from the Artificial Analysis leaderboard on the capture date shown on our leaderboard (currently September 30, 2026, index v4.3.2), or from the vendor system card an article cites inline. Plan prices in the interactive compare toolcome from our tool database and the vendors' pricing pages, and each tool page shows when its facts were last re-checked. Hands-on results are single runs; the conditions of each — attempts, effort setting, what the model could and could not do — are stated on the article. If you want the practical follow-through after a comparison, the coding-tool buyer's guide turns the numbers into a decision, and our reviews cover the same models as products you can actually buy.
Frequently Asked Questions
How does BitsMinds compare AI models?
Benchmark comparisons use one independent yardstick where possible — the Artificial Analysis Intelligence Index — alongside each vendor's published system-card figures, always labelled with the index version and the model configuration measured. Hands-on comparisons come from BitsMinds Lab, where every model gets the same brief and one attempt, and every build is live in the article.
Why do the same models have different scores in different articles?
Artificial Analysis re-bases its Intelligence Index when it changes the evaluation set, and every model's number moves. An article quotes the version current when it was written, so compare scores within one article or on the leaderboard, never across articles from different months.
Is a cheaper list price a cheaper model?
Not necessarily. Two models with the same price per million tokens can differ several-fold in what a finished task costs, because one burns far more tokens reaching its answer. Where a comparison quotes cost, it says whether that is list price per token or measured cost per task.
What is the difference between a comparison article and the compare tool?
The articles are written analyses of specific match-ups with a dated verdict. The interactive compare tool puts two or three tools' plans, features and capability scores side by side from our tool database, for any combination you choose.